Apple Valley Lake Home Sales and Real Estate Report by Sam Miller
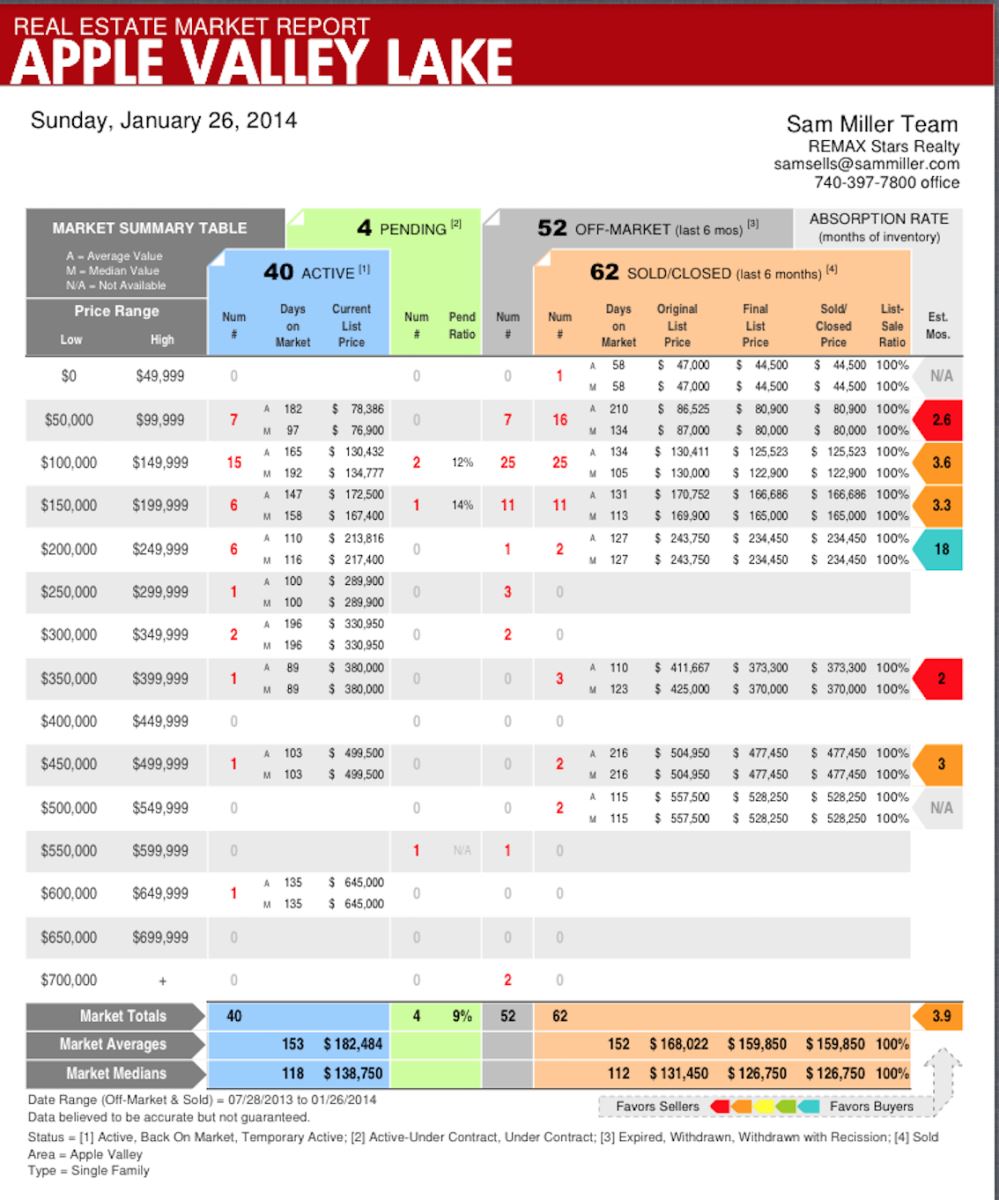
Apple Valley Lake home sales have been on the rise and we have been experiencing a boost in home sales. This report highlights the Apple Valley Lake home sales activity over the last 6 months comparing the number of Apple Valley Lake homes that sold with the available homes for sale along with pending home sales and off markets. This report offers a much more detailed view of the Apple Valley Lake real estate market than the typical reports that only show the number of homes SOLD.

The very top section of this report breaks down each segment of the Apple Valley Lake housing market and it features the absorption rate for each specific price range. This is very important because it paints the most accurate picture of the housing market and demand. Take an extra close look at the far right side of this report and you will see that the column is broken down by color coding and each color identifies if that price range currently favors buyers or sellers based on the available months of inventory. Red favors the sellers because there is a shortage of listings based on recent home sales and blue favors buyers because there is currently more available homes than buyers buying in that price range. The housing trends and absorption rates that are featured in this report are constantly changing especially during the different seasons so be sure to watch for our weekly updated Apple Valley Lake housing reports.
View our Apple Valley Lake homes for sale and you can also view our Apple Valley Lake lots for sale


